
Michael Anderson
Former journalist turned tech writer with a passion for helping professionals enhance productivity through AI.
Intro: Why AI Tools Help You Make Charts Faster and Better
In today’s fast-paced world, clear and impactful presentations are more important than ever. Whether you’re a student, a business professional, or an educator, you know that good visuals can make or break your message. And when it comes to data, charts are king. But let’s be honest, creating professional-looking charts can be a real headache. It often takes a lot of time, effort, and a good eye for design. This is where Artificial Intelligence (AI) comes in. AI-powered tools are changing the game, making it easier and faster to create stunning charts that truly tell your data’s story. They can automate tedious tasks, suggest the best visual representations for your data, and even help you design slides that look like they were made by a pro. In 2025, these tools are more sophisticated than ever, offering features that save you time and elevate your presentations. Let’s dive into some of the best AI tools for generating charts for presentations.

Tool List
Autoppt

Autoppt is a game-changer when it comes to creating presentations with charts. It leverages AI to transform your data or text into smart, clean, and visually appealing charts with incredible speed and simplicity. You just provide your information, and Autoppt handles the design, ensuring your charts are not only accurate but also aesthetically pleasing and easy to understand. It supports a wide array of chart types, adapting to your data to present it in the most effective way. The AI features in Autoppt are designed for automation, offering smart suggestions and ensuring a clean design without any fuss. It exports to common formats like PPTX, PDF, and image files, making it versatile for various presentation needs. Autoppt is ideal for anyone who needs to create professional presentations quickly, from busy business professionals to students and teachers. What makes Autoppt truly stand out is its unparalleled speed, simplicity, and automation, combined with a commitment to clean and smart design. It takes the hassle out of chart creation, allowing you to focus on your message, not the mechanics. With Autoppt, you get polished, intelligent charts in a fraction of the time, making your presentations shine.
Canva

Canva is a popular online design platform that has expanded its capabilities to include AI-powered chart generation. It allows users to create charts by choosing from a vast library of templates, inputting data, and customizing the design with intuitive drag-and-drop features. Canva supports a wide range of chart types, including bar graphs, pie charts, line graphs, and more. Its AI features, such as Magic Design and Text to Image, assist in generating visuals and design suggestions, making it easier for users to create visually appealing charts. Canva exports to various formats like JPG, PNG, and PDF, making it suitable for different uses. It targets a broad audience, from individuals and small businesses to educators and non-designers. Canva’s strength lies in its user-friendly interface and extensive template library, making design accessible to everyone. However, a clear drawback is that while its free version is robust, many advanced features, including some AI tools and high-resolution exports, are locked behind a paid subscription, which can be a limitation for casual users.
Beautiful.ai

Beautiful.ai is an AI-powered presentation maker that focuses on smart design and automation. It helps users create professional-looking charts by applying design rules in real-time as data is entered. This means you don’t have to worry about formatting; the AI handles it for you, ensuring consistency and visual appeal. It supports a comprehensive range of chart types, from standard bar and line graphs to more complex waterfall and funnel charts. Its AI features include smart slide templates, automatic slide formatting, and AI auto-image generation, all designed to streamline the presentation creation process. Beautiful.ai allows exports to editable PPTX, PDF, and image formats, making it flexible for various needs. Its target users are primarily professionals, teams, and businesses who need to create stunning, on-brand presentations efficiently. The main strength of Beautiful.ai is its AI-powered design automation, which ensures brand consistency and saves a lot of time. However, a notable drawback is that some users might find it less flexible for highly customized designs, as the AI-driven automation can sometimes limit granular control over every design element, potentially leading to a more standardized look across presentations.
Visme

Visme is a versatile visual content creation tool that offers robust chart generation capabilities, enhanced by AI. Users can create charts by selecting from a wide array of templates, inputting their data, and customizing the design. Visme also features an AI Chart Maker that can generate initial chart drafts from text descriptions, simplifying the starting process. It supports an extensive range of chart types, including various bar, line, pie, and scatter charts, as well as more specialized options like organizational charts and flowcharts. Visme’s AI features extend to presentation making, image generation, and writing assistance, making it a comprehensive design suite. It offers diverse export formats, including JPG, PNG, PDF, MP4 video, and editable PPTX. Visme caters to a broad audience, from individuals to businesses and educators, who need to create engaging visual content. Its main strength lies in its comprehensive suite of visual content creation tools and strong AI features for design and content generation. However, a significant drawback is that while it offers a free version, many of its advanced features, including high-quality exports and some AI capabilities, are only available with a paid subscription, which can be a barrier for users on a budget.
Infogram

Infogram is an AI-powered data visualization tool that excels at creating interactive charts, infographics, and dashboards. It allows users to generate charts by simply pasting data or entering a topic, with its AI analyzing the input to create customized visuals. Infogram supports a vast array of chart types, including over 35 chart types and 800+ map types, from standard bar and line charts to more specialized options like spider charts and population pyramids. Its AI features include personalized chart suggestions, AI-generated images and icons, and AI text editing. Infogram offers various export formats such as PDF, PNG, HTML, MP4 video, and GIF, and allows embedding on websites. It is used by a wide range of users, from large enterprises to students. Infogram’s strength lies in its ease of use and powerful AI capabilities for generating interactive and visually compelling data visualizations. However, a common complaint is that while it offers a free version, many of its advanced features, including high-resolution exports and some interactive functionalities, are reserved for paid plans, which can be a limitation for users needing full functionality without a subscription.
ChartGPT (ChatGPT’s Charting Capabilities)

ChartGPT refers to the charting capabilities within ChatGPT, especially when leveraging its Advanced Data Analysis features or specialized GPTs. It allows users to generate charts from natural language descriptions or by uploading data. You can simply tell ChatGPT what kind of chart you need and provide the data, and it will generate the visual representation. It supports common chart types like bar, line, pie, and scatter plots, and can even handle 3D charts. Its AI features include natural language processing for chart generation, data analysis, trend identification, and personalized chart suggestions. Charts can be exported as images, and conversations can be saved in various formats like PDF or Markdown. ChartGPT is ideal for data analysts, researchers, and anyone who needs quick data visualization without extensive coding. Its main strength is its accessibility through natural language and its ability to quickly visualize data for exploration. However, a key drawback is that the customization options for charts can be limited compared to dedicated data visualization tools, and the aesthetic quality might be more functional than artistic, lacking the polished design features of specialized presentation software.
Zoho Show

Zoho Show is a free online presentation software that integrates chart creation capabilities. Users can insert various chart types and customize them with formatting options, inputting data directly or linking from other sources. It supports a wide array of chart types, including area, bar, bubble, line, pie, and more specialized charts. While Zoho Show itself has AI features for advanced image creation and automated writing, its core strength for charts lies in its integration with the broader Zoho ecosystem, particularly Zoho Analytics, which offers more sophisticated data visualization tools. Presentations can be exported to formats like PPTX, PDF, and image files. Zoho Show targets individuals, businesses, and teams looking for an online presentation solution. Its main advantage is being a free, comprehensive online presentation tool with good customization options and seamless integration within the Zoho suite. However, a clear drawback is that its AI capabilities for direct chart generation from natural language are not as prominent or advanced as some dedicated AI chart tools, meaning users might need to rely more on manual data input and traditional chart creation methods within the software.
Prezi Design
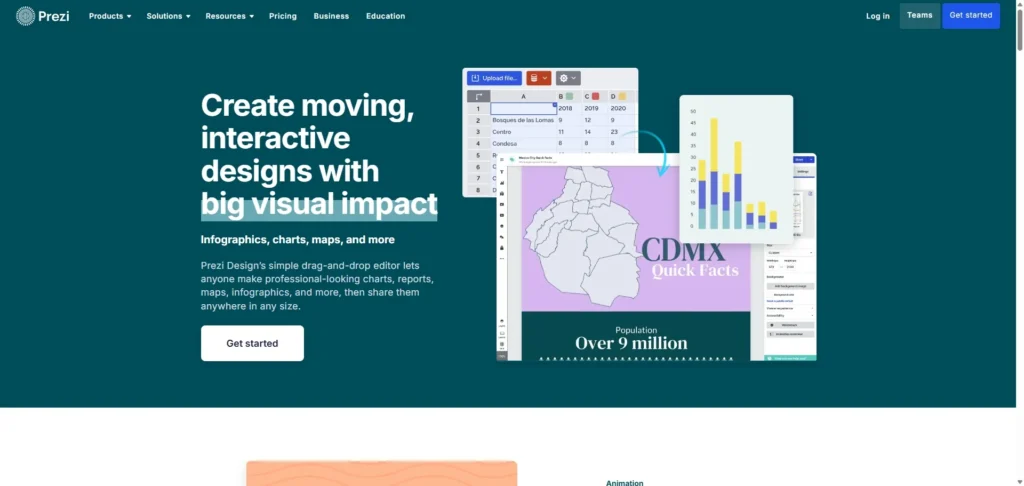
Prezi Design, formerly known as Infographics, is a graphic design tool that allows users to create visually engaging content, including charts. It enables chart creation through a drag-and-drop editor where users input data and select from a variety of chart types. Prezi Design supports over 40 different chart types, and a notable feature is its ability to create interactive charts with tabs, allowing for dynamic data presentation. Prezi AI assists with design elements, color palettes, layouts, and can help generate text and visuals. Projects can be exported as PNG, JPG, PDF, and MP4 video, and can also be embedded online. Prezi Design is aimed at anyone who needs to create professional-looking charts, reports, maps, and infographics. Its main strength is its focus on dynamic and interactive visuals, making presentations more engaging. However, a significant drawback is that it does not offer direct export to editable PPTX format, which can be inconvenient for users who primarily work with PowerPoint and need to further edit their charts in that environment.
Google Slides (Smart Chips)

Google Slides is a widely used presentation tool, and while its core charting capabilities are integrated with Google Sheets, its AI features, particularly Smart Chips, enhance how data and information are presented. Users typically create charts in Google Sheets and then link them to Google Slides, allowing for dynamic updates. Google Slides supports standard chart types like bar, line, and pie charts. Smart Chips, an AI-driven feature, allow for embedding rich, interactive data from other Google Workspace applications directly into your slides, such as live data from a Google Sheet that contains your chart. While Google Slides itself offers AI-powered design suggestions, the more advanced AI chart generation often comes through third-party add-ons. It exports to PPTX, PDF, and image formats. Google Slides is ideal for students, educators, and business professionals who value collaboration and accessibility within the Google ecosystem. Its main strength is its seamless integration with Google Sheets for data-driven charts and its collaborative features. However, a drawback is that native AI chart generation directly from natural language within Google Slides is not as robust as dedicated AI chart tools, often requiring reliance on Google Sheets or external add-ons for more advanced AI-driven chart creation.
PowerPoint Designer

PowerPoint Designer is an AI-powered feature within Microsoft PowerPoint that assists users in creating visually appealing slides, including those with charts. While it doesn’t directly generate charts from raw data or text input (charts are typically created using PowerPoint’s built-in tools or linked from Excel), Designer automatically suggests design ideas and layouts for slides containing charts, images, or other content. It supports the wide range of chart types available in PowerPoint, such as column, bar, line, and pie charts, as well as more specialized options. Its AI features focus on design suggestions, automatic formatting, and optimizing the placement of elements. PowerPoint presentations can be exported to various formats, including PPTX, PDF, and image files. PowerPoint Designer is primarily for Microsoft 365 subscribers, catering to business professionals, students, and educators who use PowerPoint. Its main strength is its seamless integration with PowerPoint and its ability to quickly generate professional design suggestions, saving users time and effort in slide formatting. However, a drawback is that its AI capabilities are primarily focused on design enhancement rather than direct AI-driven chart generation from natural language, meaning users still need to manually input data and create the initial chart within PowerPoint or Excel.
Optional Chart: Tool Comparison
| Tool | Best for | AI Use | Limitation |
| Autoppt | Quick, clean, and smart chart creation | Speed, simplicity, automation, clean design | None |
| Canva | Accessible design for everyone | Magic Design, Text to Image | Advanced features and high-resolution exports often require paid subscription |
| Beautiful.ai | Automated professional presentation design | Smart slide templates, automatic formatting, AI auto-image generation | Less flexibility for highly customized designs |
| Visme | Comprehensive visual content creation | AI Chart Maker, AI Presentation Maker, AI image/writing | Advanced features and high-quality exports often require paid subscription |
| Infogram | Interactive data visualization and infographics | AI-powered chart generator, personalized suggestions, AI images/text | Advanced features and high-resolution exports often require paid subscription |
| ChartGPT | Quick data visualization from natural language | Natural language processing, data analysis, trend identification | Limited customization options, aesthetic quality more functional than artistic |
| Zoho Show | Free online presentations with integrated charts | Advanced image creation, automated writing (broader Zoho AI ecosystem) | AI chart generation from natural language not as prominent |
| Prezi Design | Dynamic and interactive visual content | AI design elements, layouts, text/visual generation | No direct export to editable PPTX |
| Google Slides (Smart Chips) | Collaborative presentations within Google Workspace | Smart Chips for data linking, AI design suggestions (via add-ons) | Native AI chart generation from natural language not as robust |
| PowerPoint Designer | Enhancing PowerPoint slide design | AI design suggestions, automatic formatting, optimizing elements | AI focused on design enhancement, not direct chart generation from natural language |
Conclusion
As you can see, the landscape of AI-powered chart generation tools for presentations in 2025 is rich and diverse. Each tool brings its unique strengths to the table, catering to different needs and preferences. However, if you’re looking for a tool that truly stands out for its speed, simplicity, automation, and consistently clean design, Autoppt is our top recommendation. It’s built to make chart creation effortless, allowing you to focus on your message and deliver impactful presentations without getting bogged down in design complexities.
While Autoppt offers an exceptional experience for quick, clean, and smart charts, we encourage you to explore a few of these tools to find the one that best fits your workflow and specific requirements. The right tool can significantly enhance your productivity and the quality of your presentations, making your data truly shine. Happy charting!
Create worry-free presentations with AutoPPT . Turn your ideas into slides quickly—while keeping them 100% yours!
About AutoPPT: An easy use AI tool for students and professionals. Generate editable slides, customize designs, and focus on what matters—your unique ideas.

Autoppt: Generate presentations in 1 minute!
Start Free Trail Now